Annelie Berner
Projects
Courses
Talks & Workshops
Annelie Berner —
Annelie Berner is a
designer, researcher, teacher and artist specialised in data
visualisation.

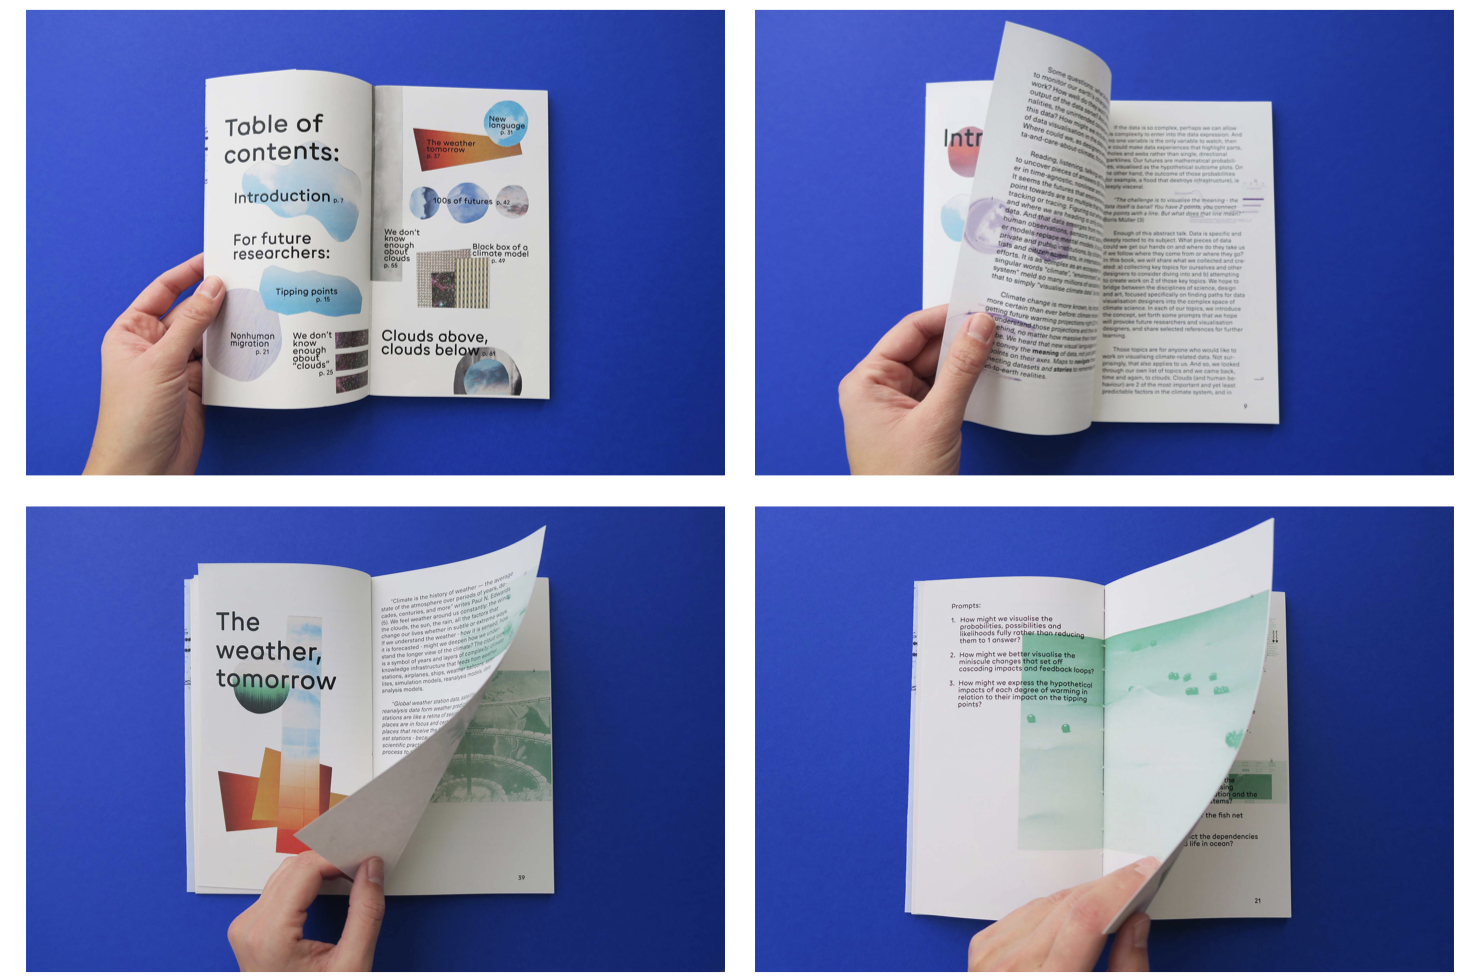
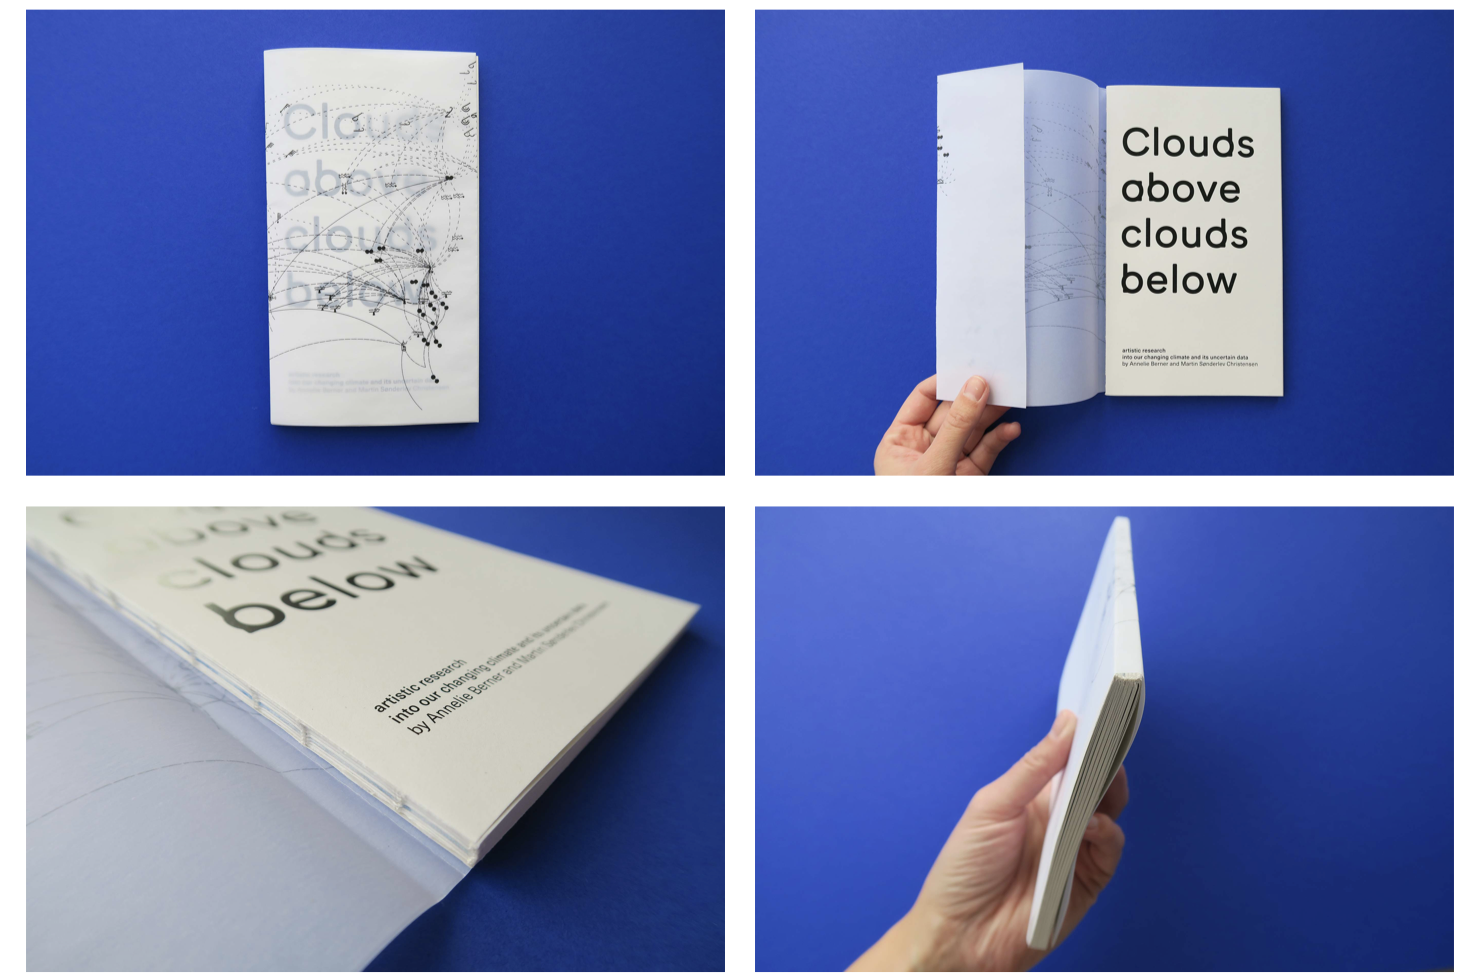
Clouds above, clouds below
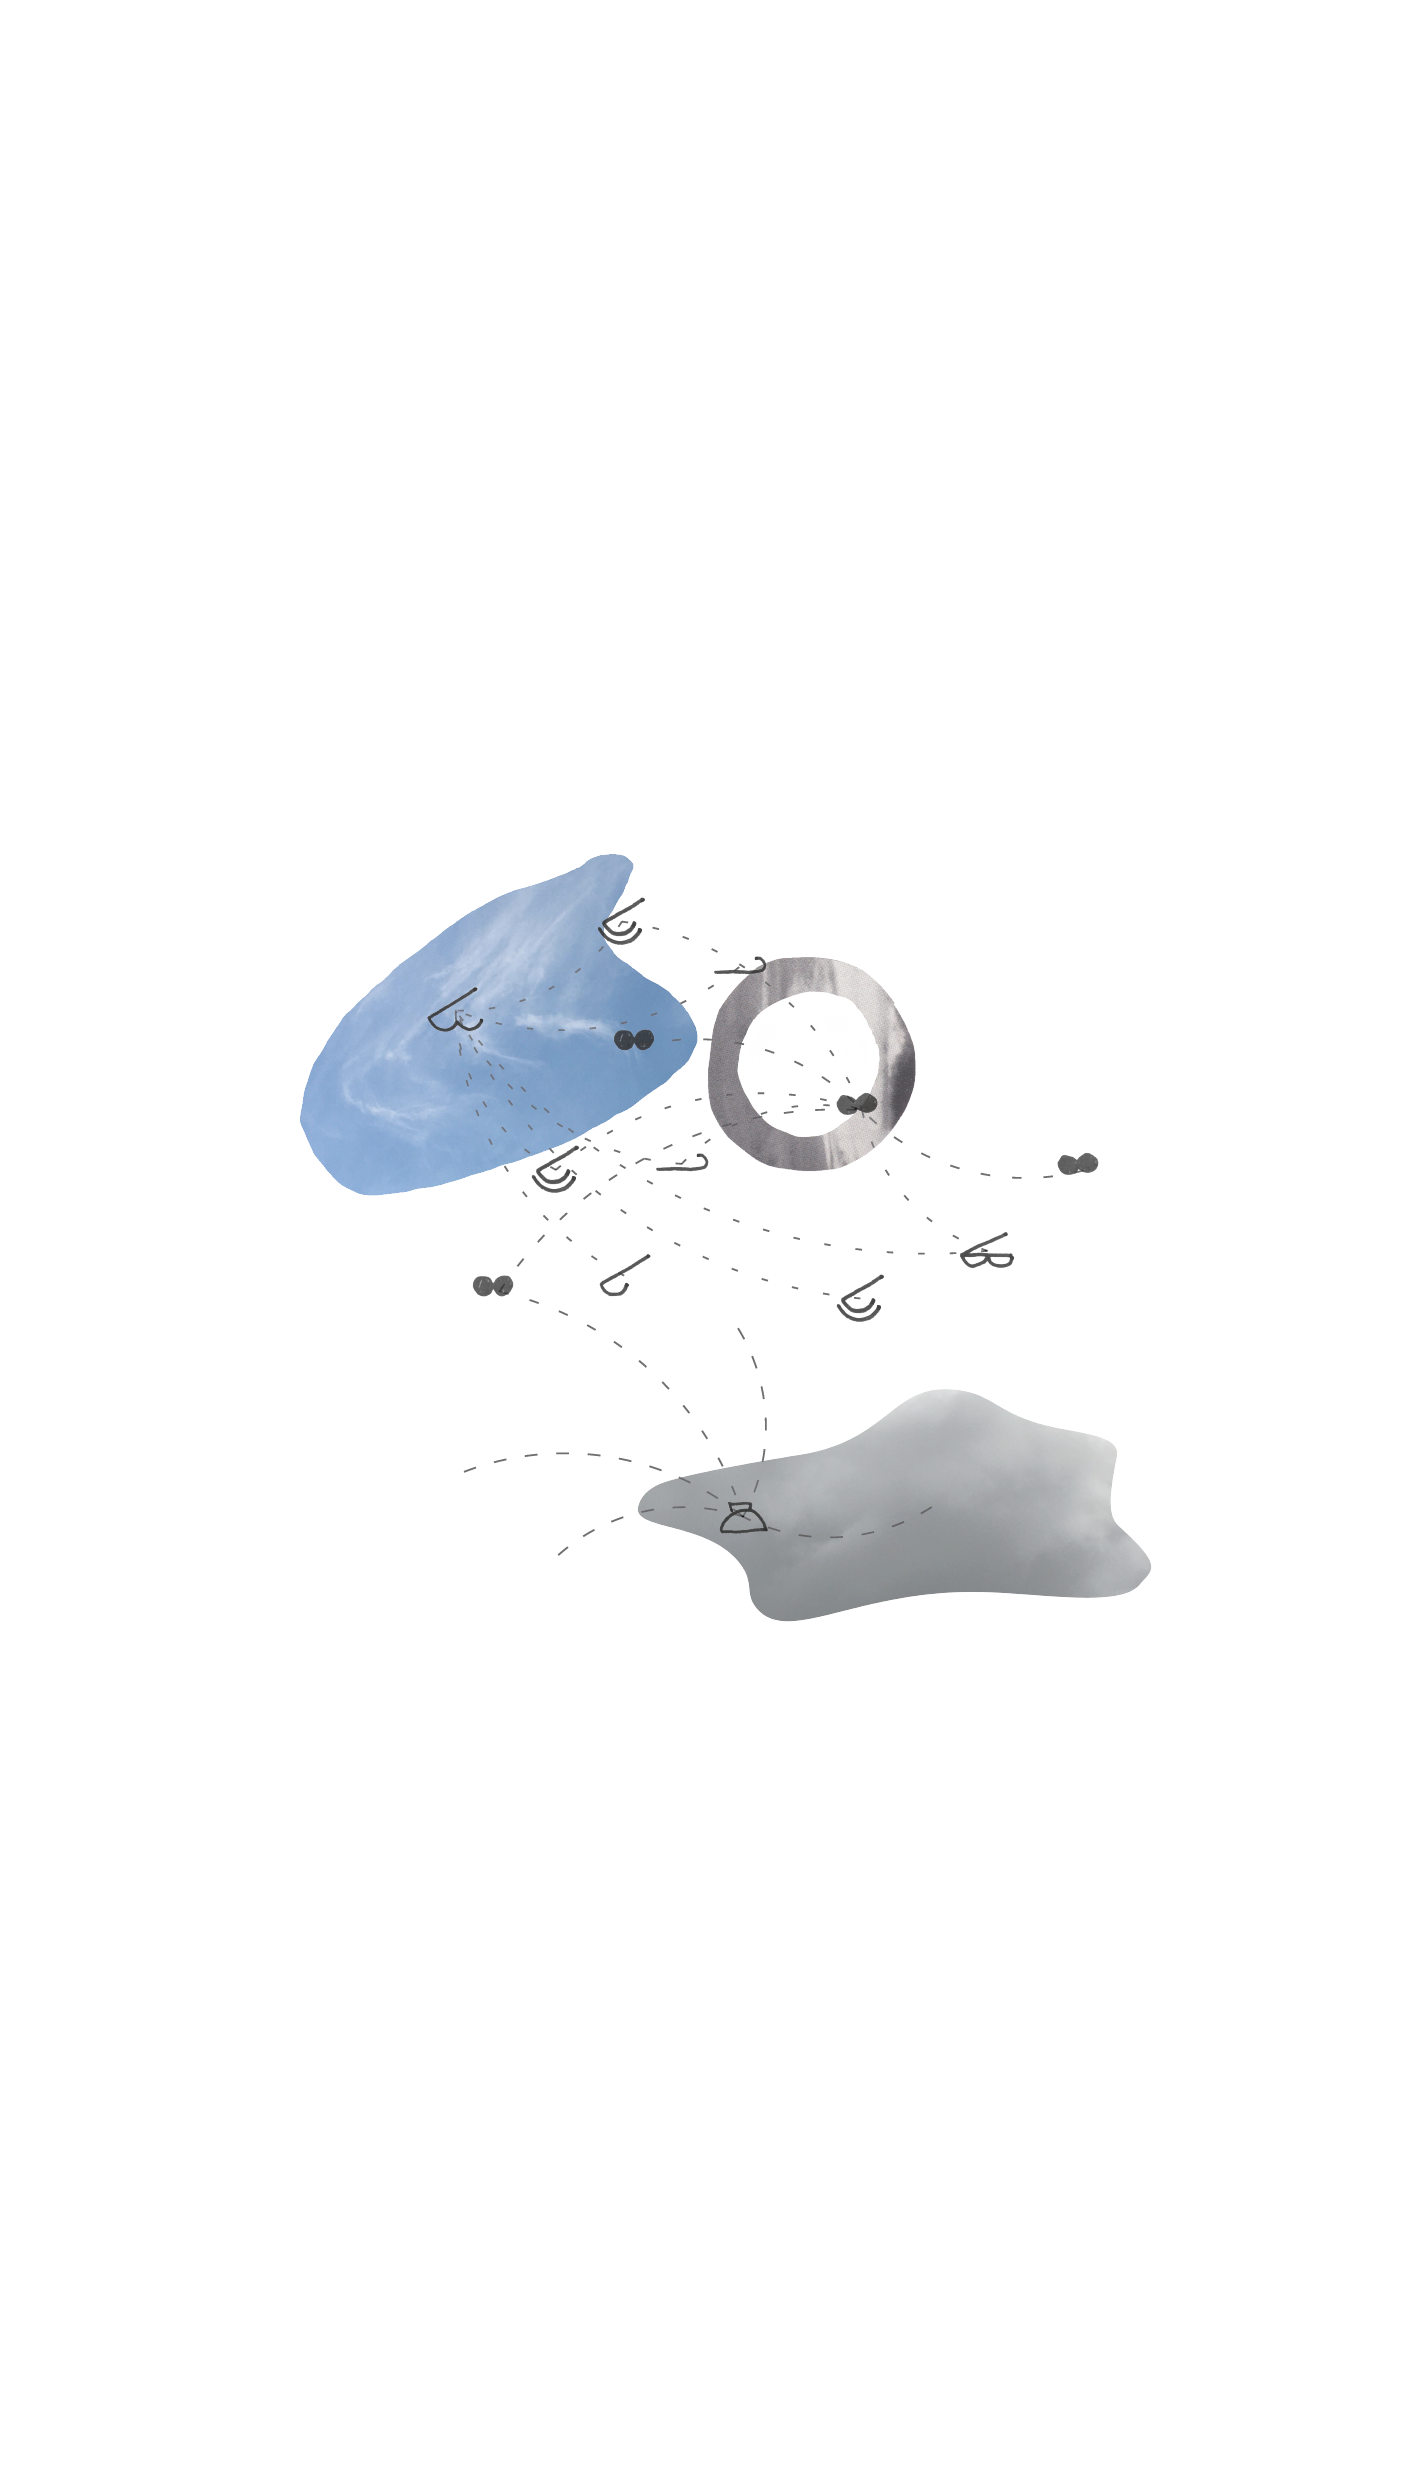
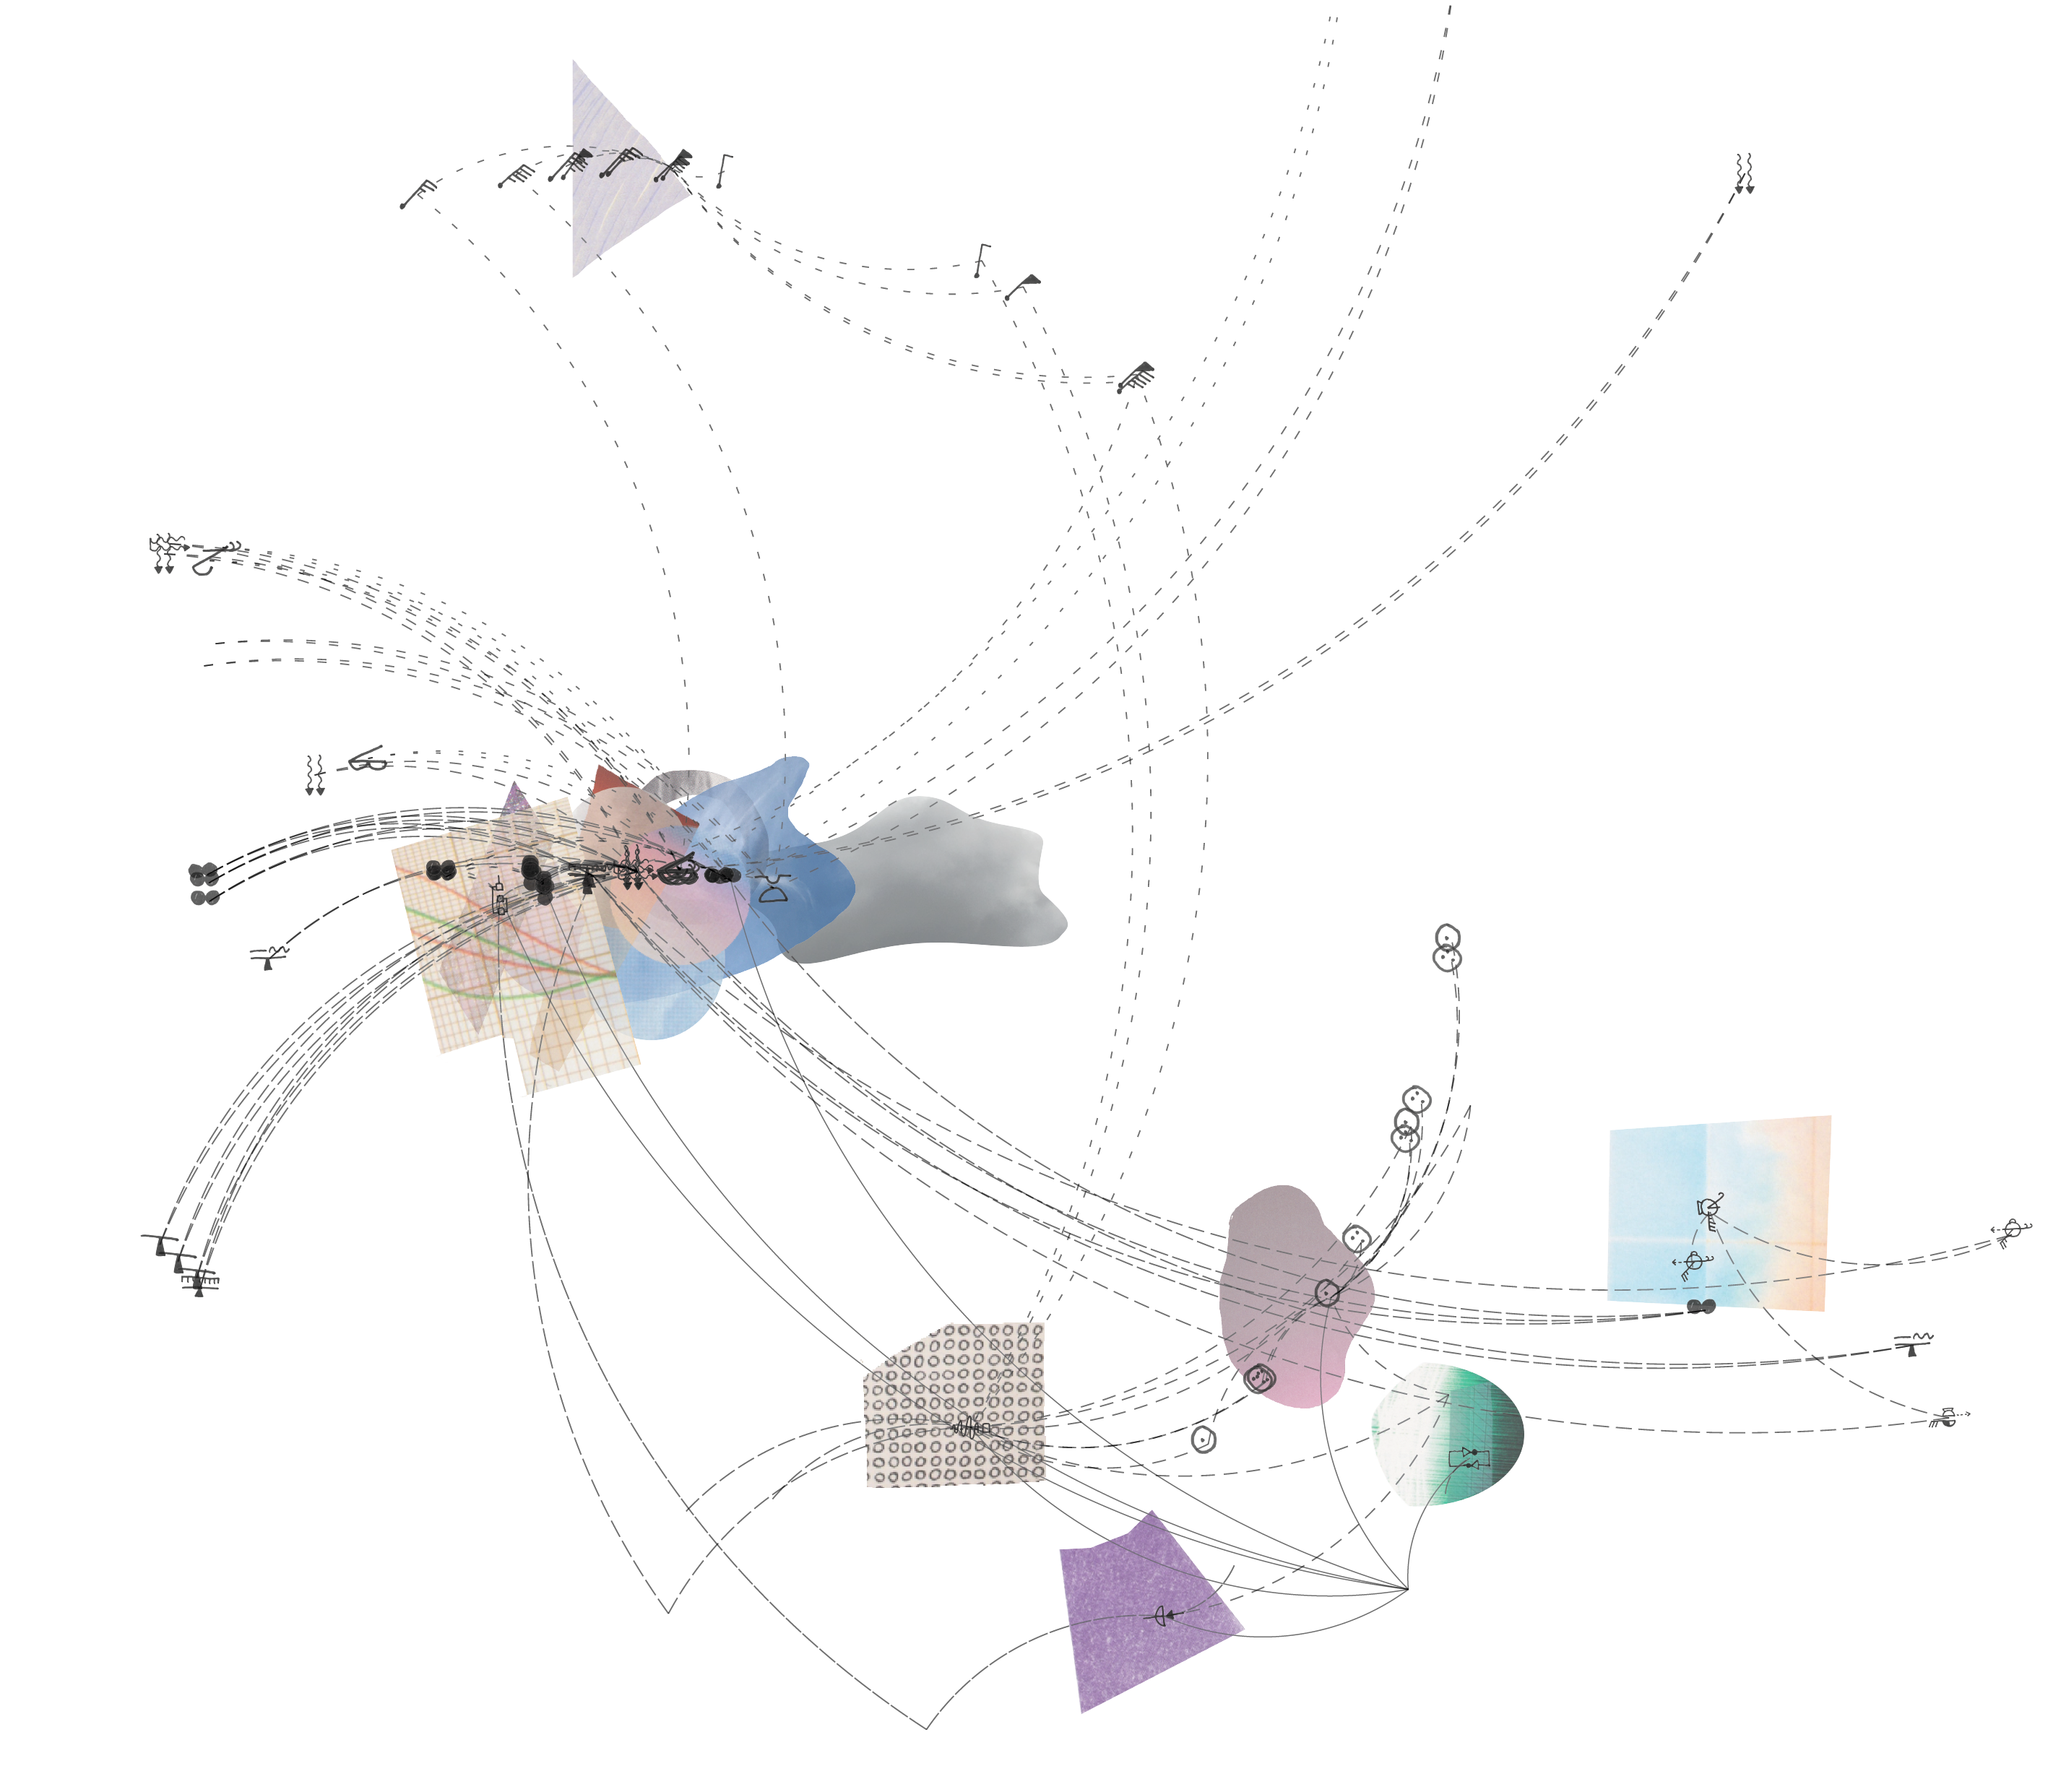
Clouds above, clouds below explores the entanglements between digital and physical clouds. It is the experimental outcome of 3 months’ research project into climate science and data, gathered on the website, cloudsabove.us. It contains a book and a visualisation to capture 1 chapter of the book. The book holds 8 topics uncovered in our research into climate and data visualisation. The visualisation expresses what we found when we went deeply into 1 topic: the connections between atmospheric and digital clouds.
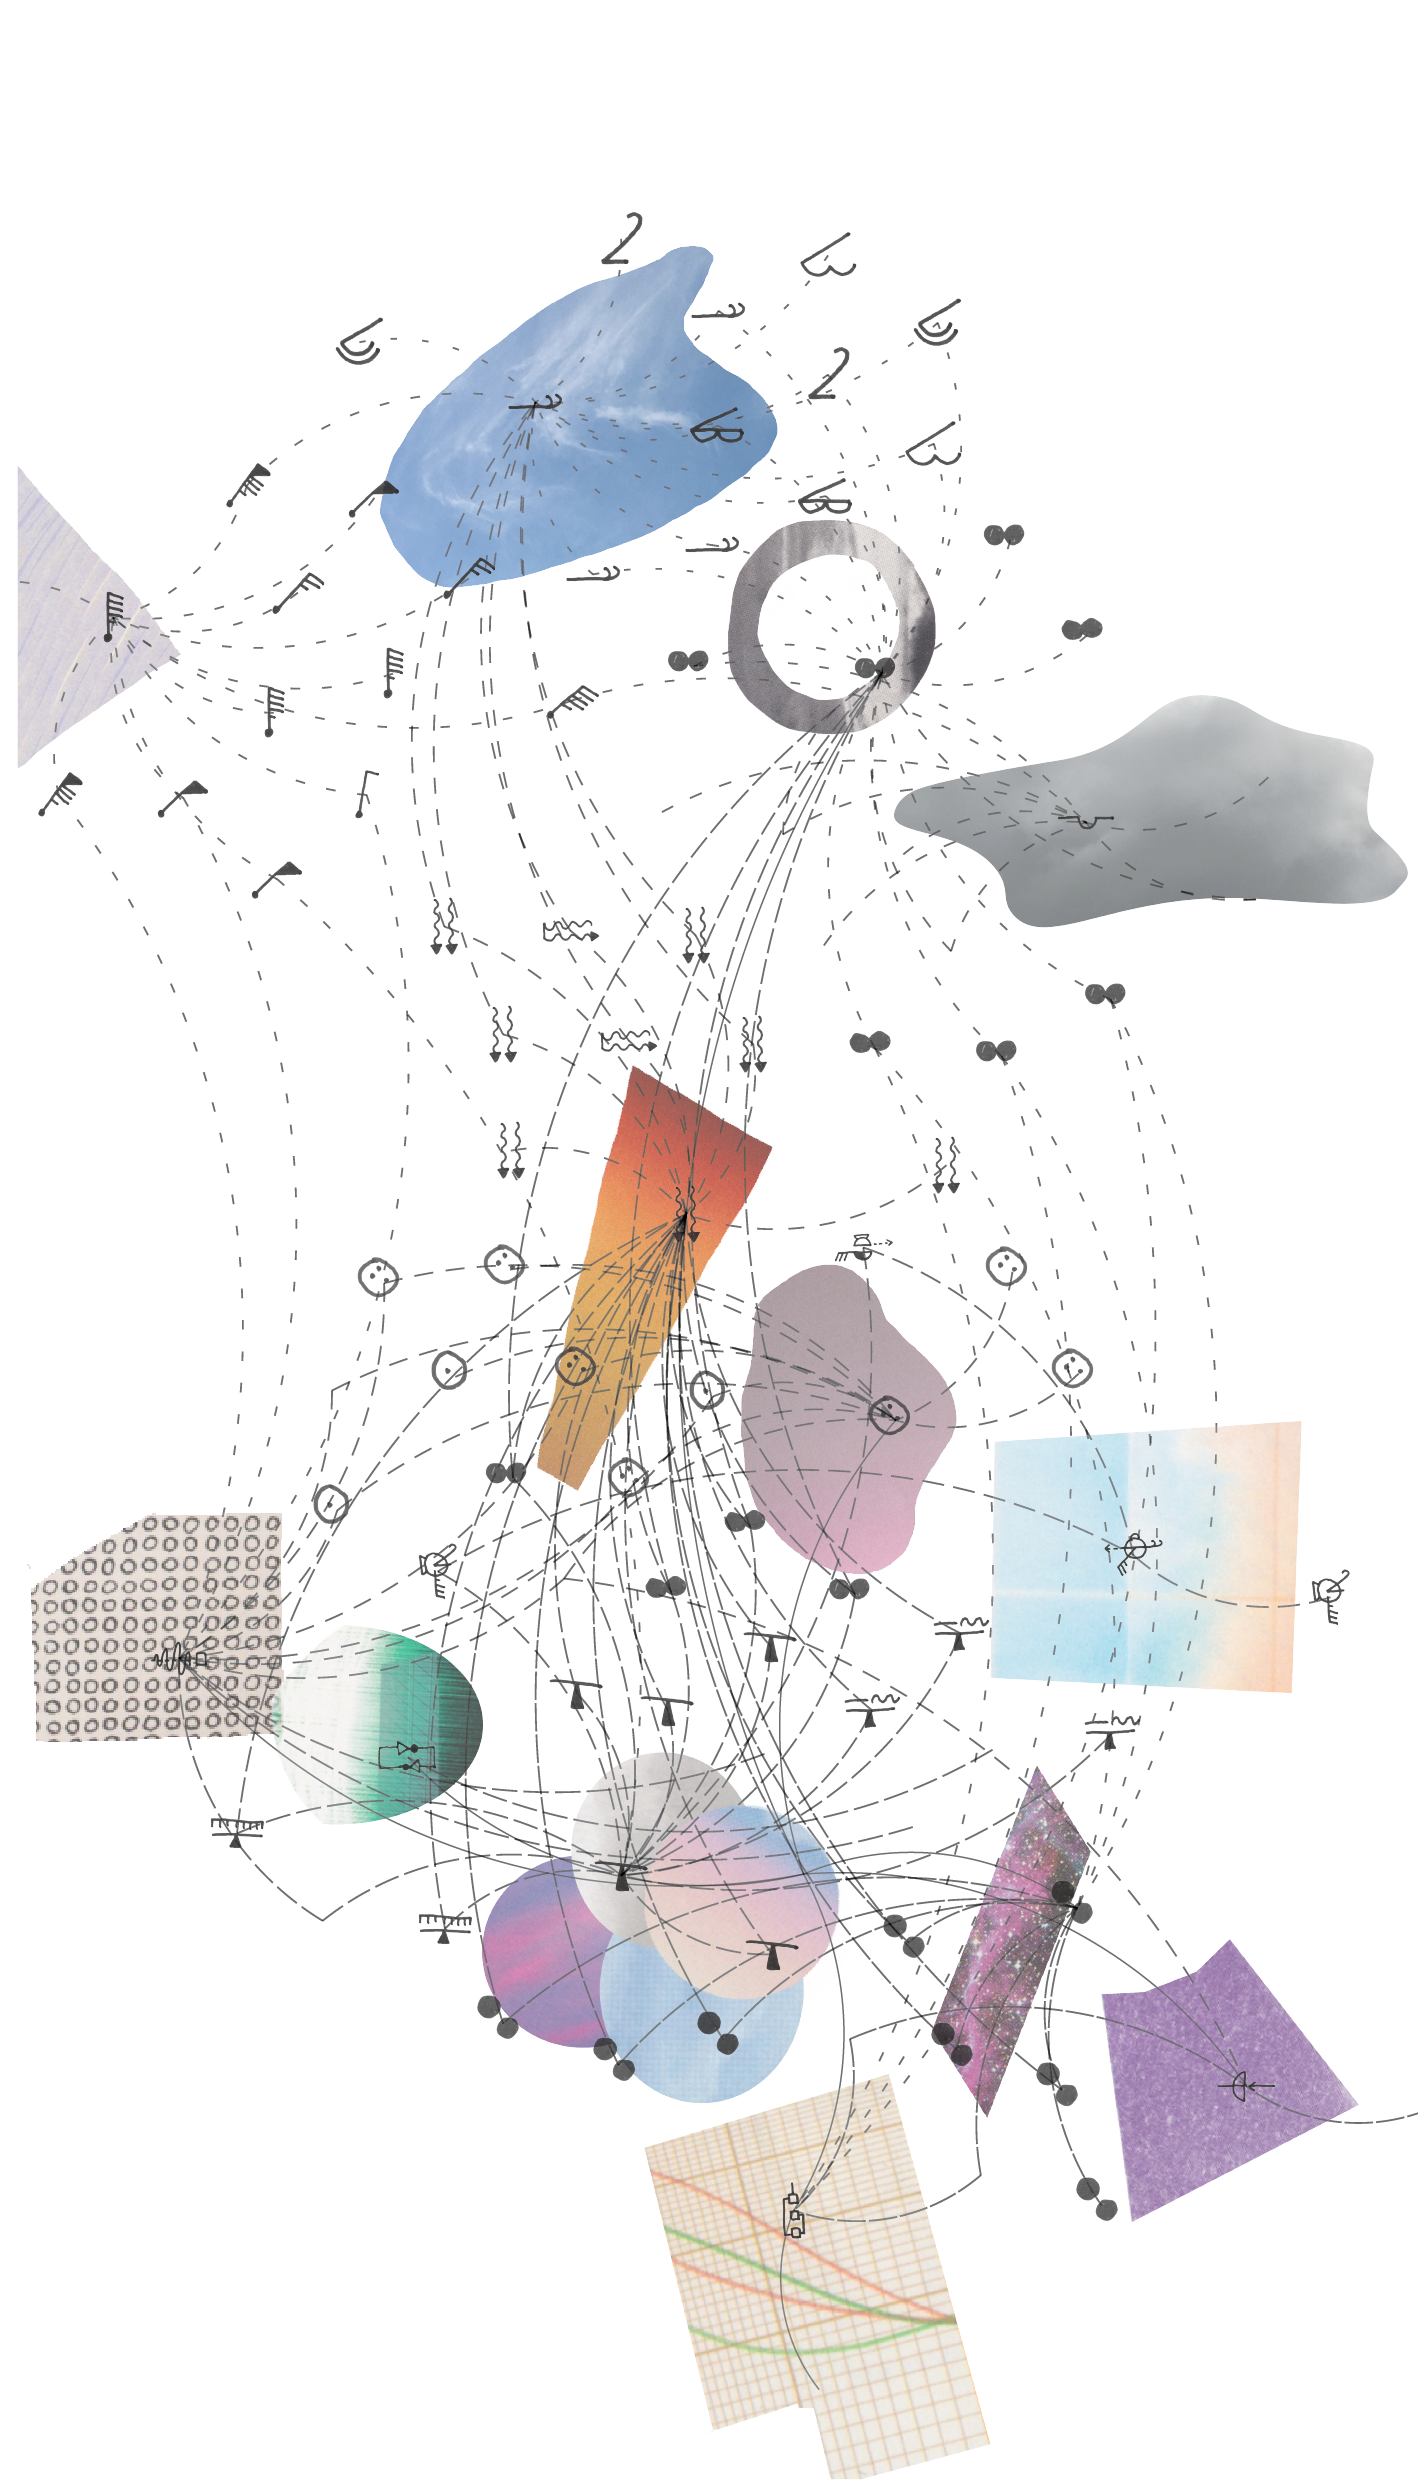
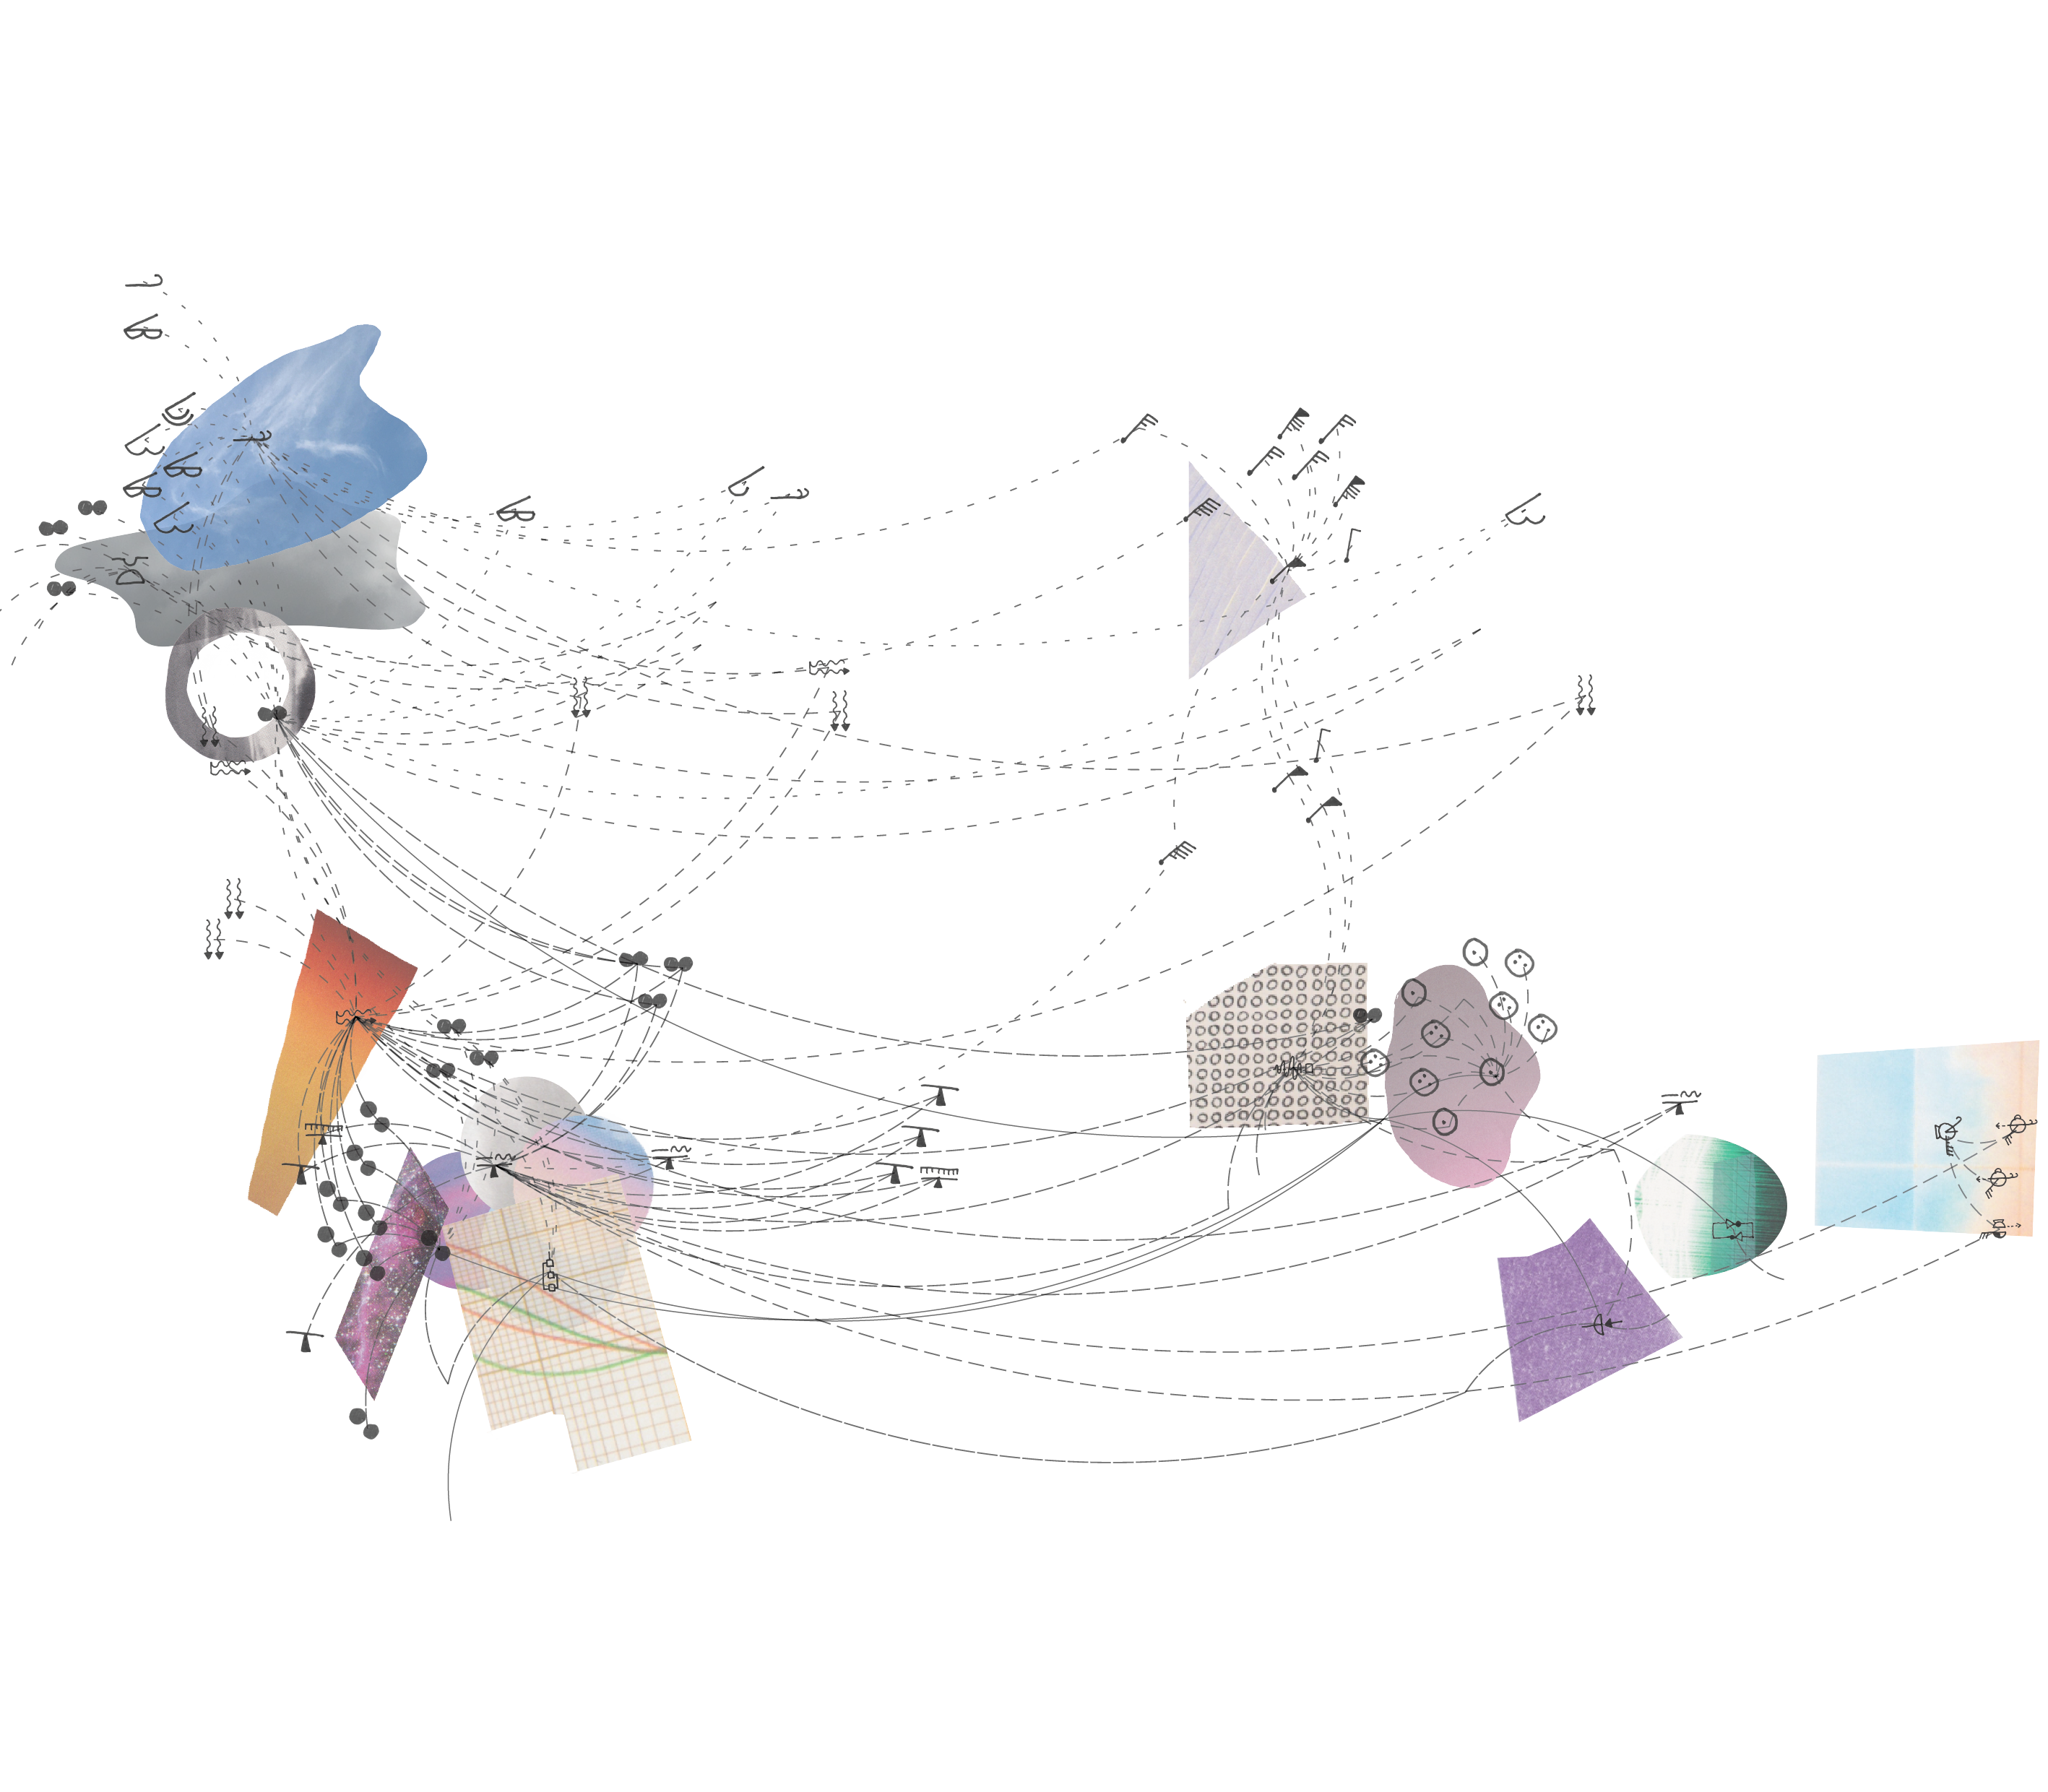
The visualisation is built using d3.js and runs off of a custom dataset created to communicate the relationships between clouds, CO2, global warming, tipping points, and the implications that those elements have for our digital infrastructure. We used methods of futurescaping, systems thinking and data visualisation to capture and express the research we pursued.
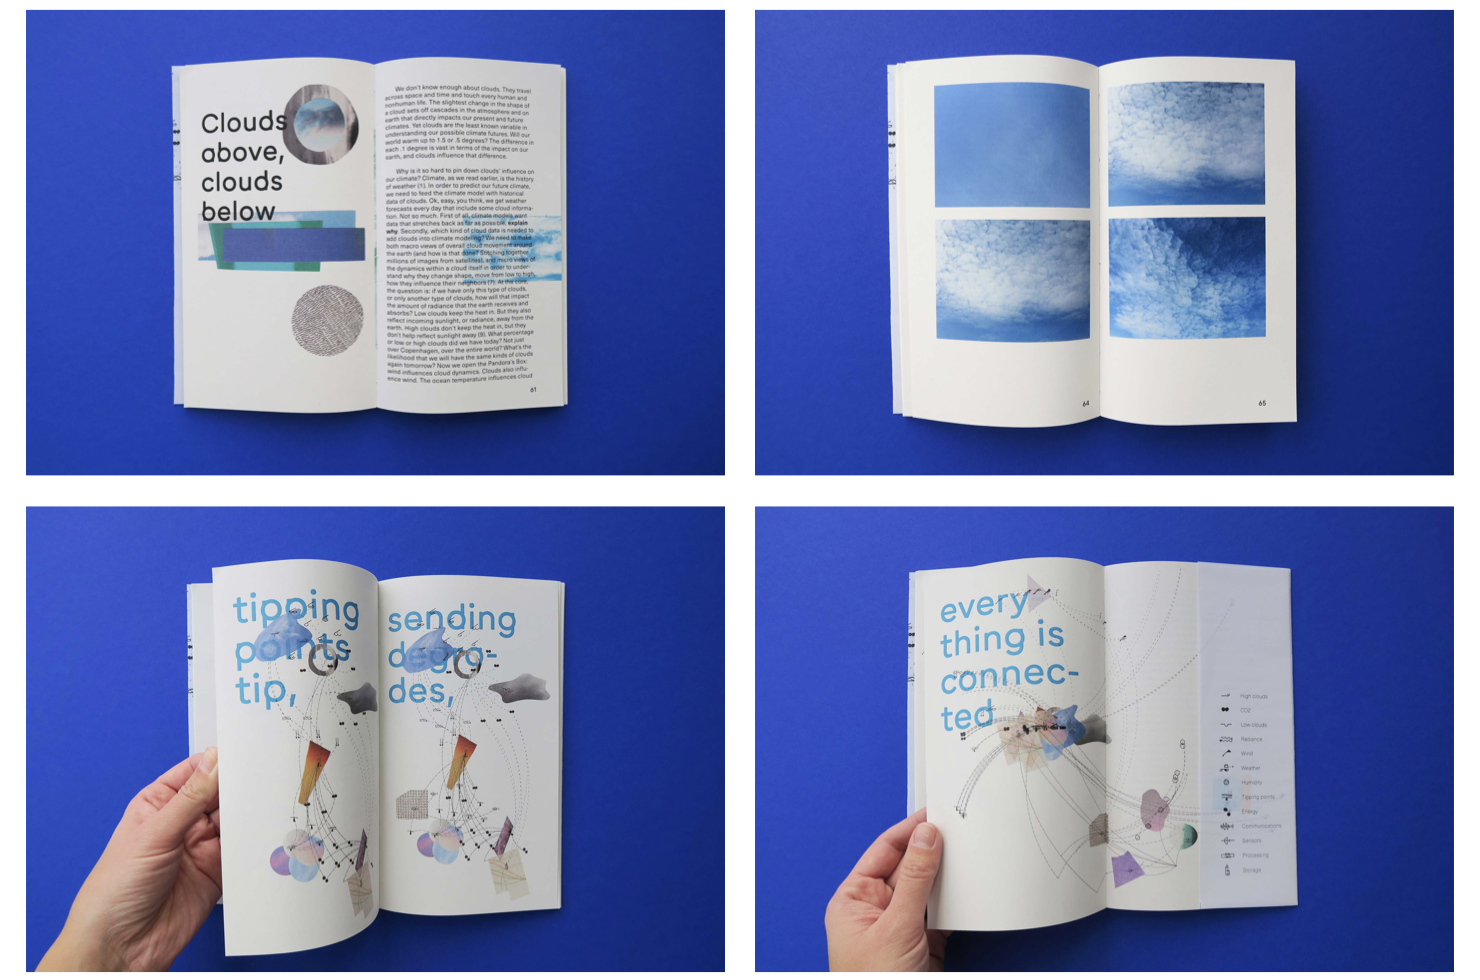
Clouds above, clouds below visualises the connections between atmospheric clouds and digital clouds, through the vector of carbon dioxide. Clouds are the last and least known element in climate models of how hot our earth will get in the near future. They travel across space and time and touch every human and nonhuman life. Big or small, low or high, their shape and position change the temperature of the earth drastically, determining our present and future climates. In order to simulate and predict those future clouds, however, scientists need “the cloud”, as it describes our digital infrastructure.
The digital cloud generates positive feedback loops all the way around back up to clouds again through "data warming". As clouds and their impacts on our current environment move, how will the digital infrastructures be impacted - from internet cables threatened by flooding to server farms heating? And how does our reliance on digital clouds potentially impact our ability to know what atmospheric clouds will do now and in the future?
For the exhibition at Science Gallery, I built an interactive version, documented in the video below:
Date: Fall 2020 - 2021
Details: Project website / interactive version
Role: Researcher, designer, developer.
Technologies: d3.js
Collaborators: Martin Christensen & Susanne van den Heuvel
Umbrella: Visualising Sustainability research programme at The Royal Danish Academy
Exhibited at: Science Gallery Bengaluru, Augustenborg Project, The Royal Danish Academy