Annelie Berner
Projects
Courses
Talks & Workshops
Annelie Berner —
Annelie Berner is a
designer, researcher, teacher and artist specialised in data
visualisation.

Cupcakes Index
Cupcakes Index is a playful experience of subjective data, physical experiences and expansion of senses for which we design. In the project, I baked the dataset of the Happiness Index into variations of sugar for tiny cupcakes (one cupcake per country) and then had my tasters map their perception of the sweetness on a chart. Thus the saddest country was the most bitter, the happiest, the sweetest.
My inspiration for the project began when I read about the World Happiness Report, published by the Earth Institute. The report measured something that can seem so subjective and converted it into data. In fact, the scientific term for happiness is “subjective well being.” How can data describe ephemeral, momentary spikes of happiness or sadness in daily life?
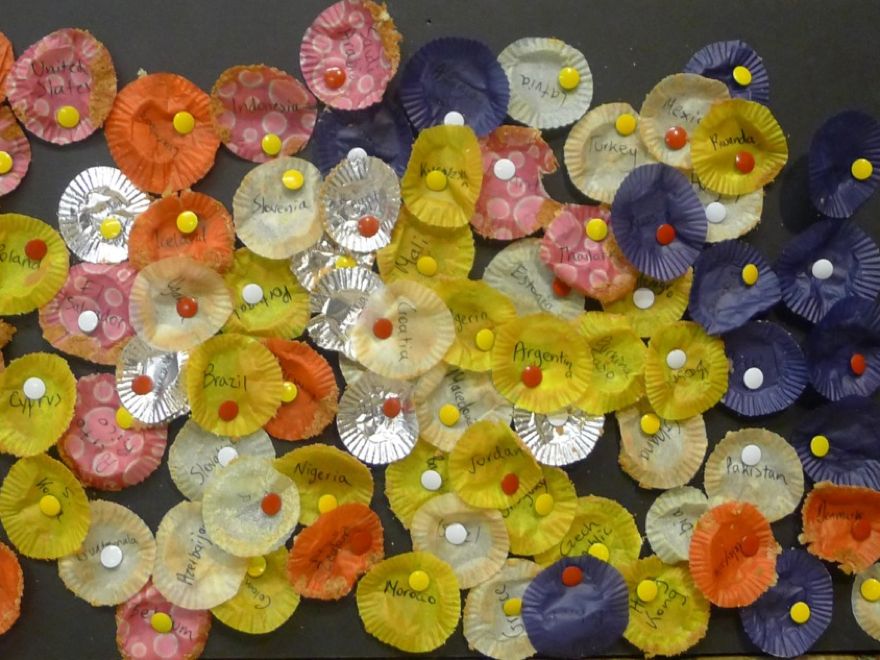
Continuing to play along these lines of subjectivity, I using taste - sugar to build a physical data experience. I translated the Happiness Index into tangible, tastable cupcakes: 96 cupcakes, where each country had its own, unique amount of sugar, starting with Bulgaria, who had the least amount of happiness and the least amount of sugar.

 Colored cupcake wrappers encode the progress from least happy at dark blue, then brown, yellow, pink and bright red for the most happy.
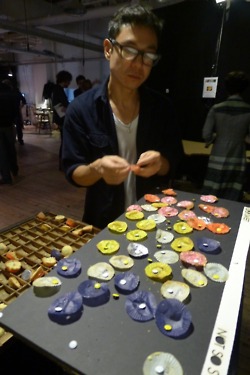
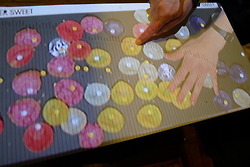
After you eat a cupcake, plot how sweet you found it to be by pinning the wrapper onto a spectrum. Then check how closely your plotting matches the formal graph of the Index through a video feed that projects the plotting spectrum onto a formal graph (image at right).
Date: 2013
Details: Project website
Role: Designer
Awards: Notable for Food Design in Core77 Design Awards 2013