Annelie Berner
Projects
Courses
Talks & Workshops
Annelie Berner —
Annelie Berner is an interaction designer specialised in data visualisation.

Diverse Futures
How do we visualise the many dreams and perspectives people have about the futures? As part of an upcoming exhibition by the LAB at Rockwell Group, the Smithsonian and Institute for the Future, I designed a series of data visualisations to bring together the answers that visitors leave as they move through collections of 150 ideas, objects, and technological innovations.
The questions ask visitors to give their input on hope and power with regards to topics that range from climate change to world peace. Visitors also leave their opinions about time travel, AI doctors and free education, among many more.
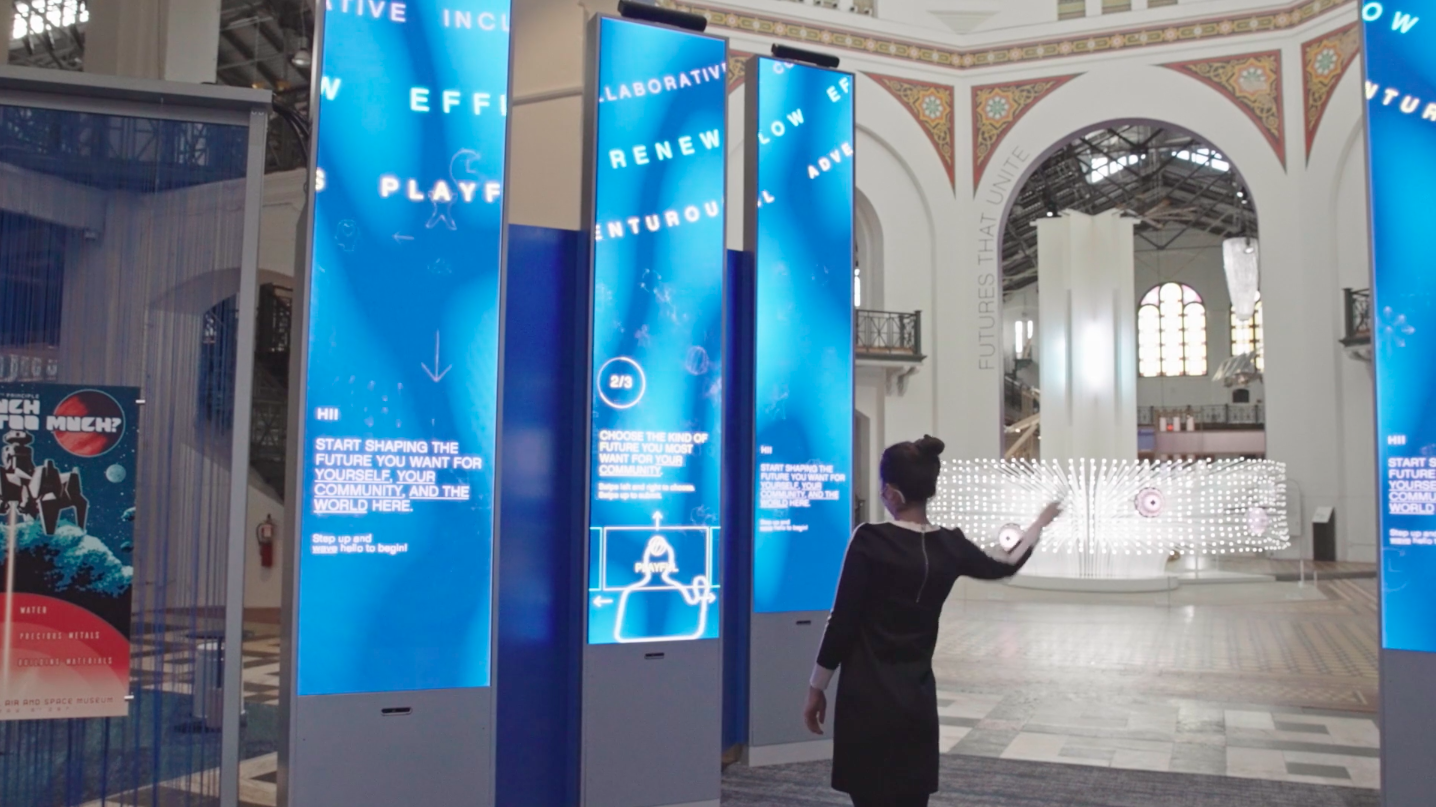

Image from exhibition opening - another interaction beacon - “How much power do you have to make the world more peaceful?”
However, when I joined the project, the exhibition had not yet launched (the above images are post launch). Thus I did not yet have the mass of visitor data we expected to collect over time. Yet through discussions with the question creators (IFTF) and surveys shared internally, I identified themes and possible patterns that might occur once the exhibition launched and the data was gathered. I came up with these themes and the concepts that would support them.
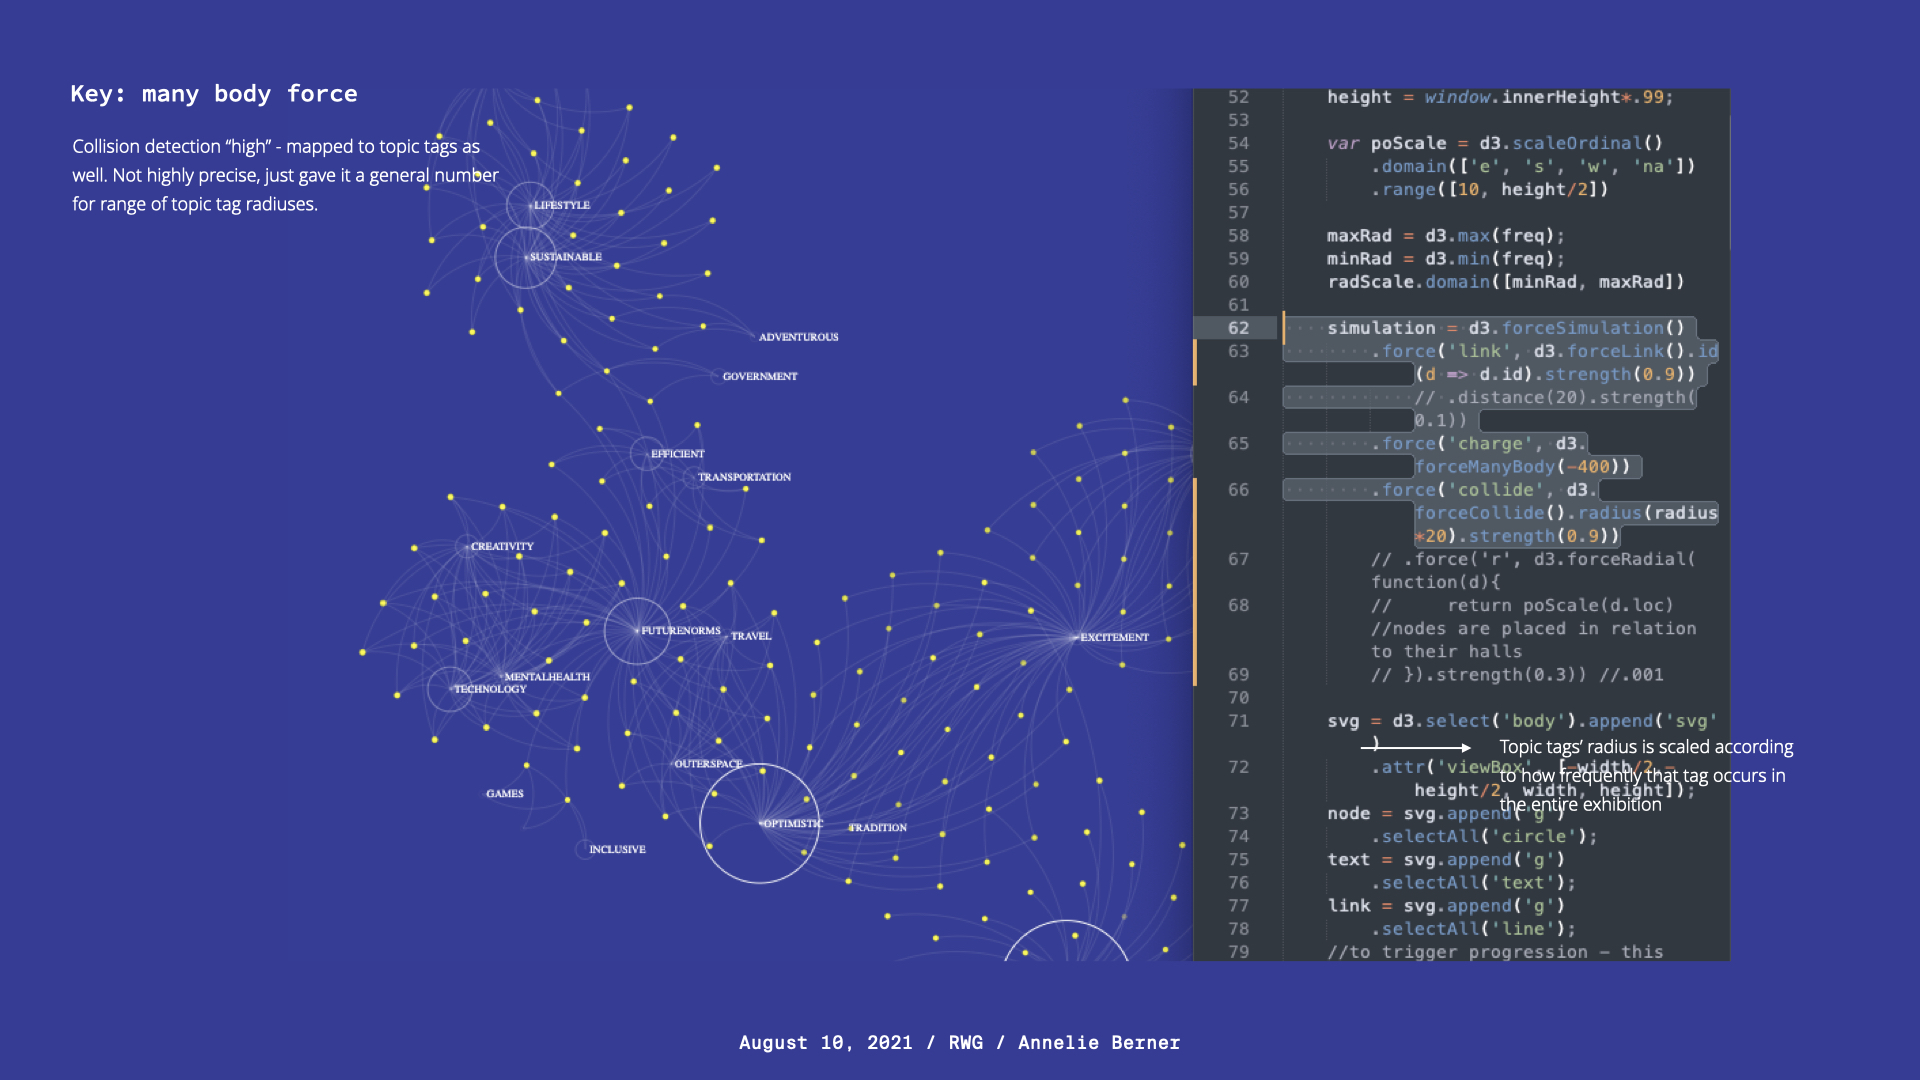
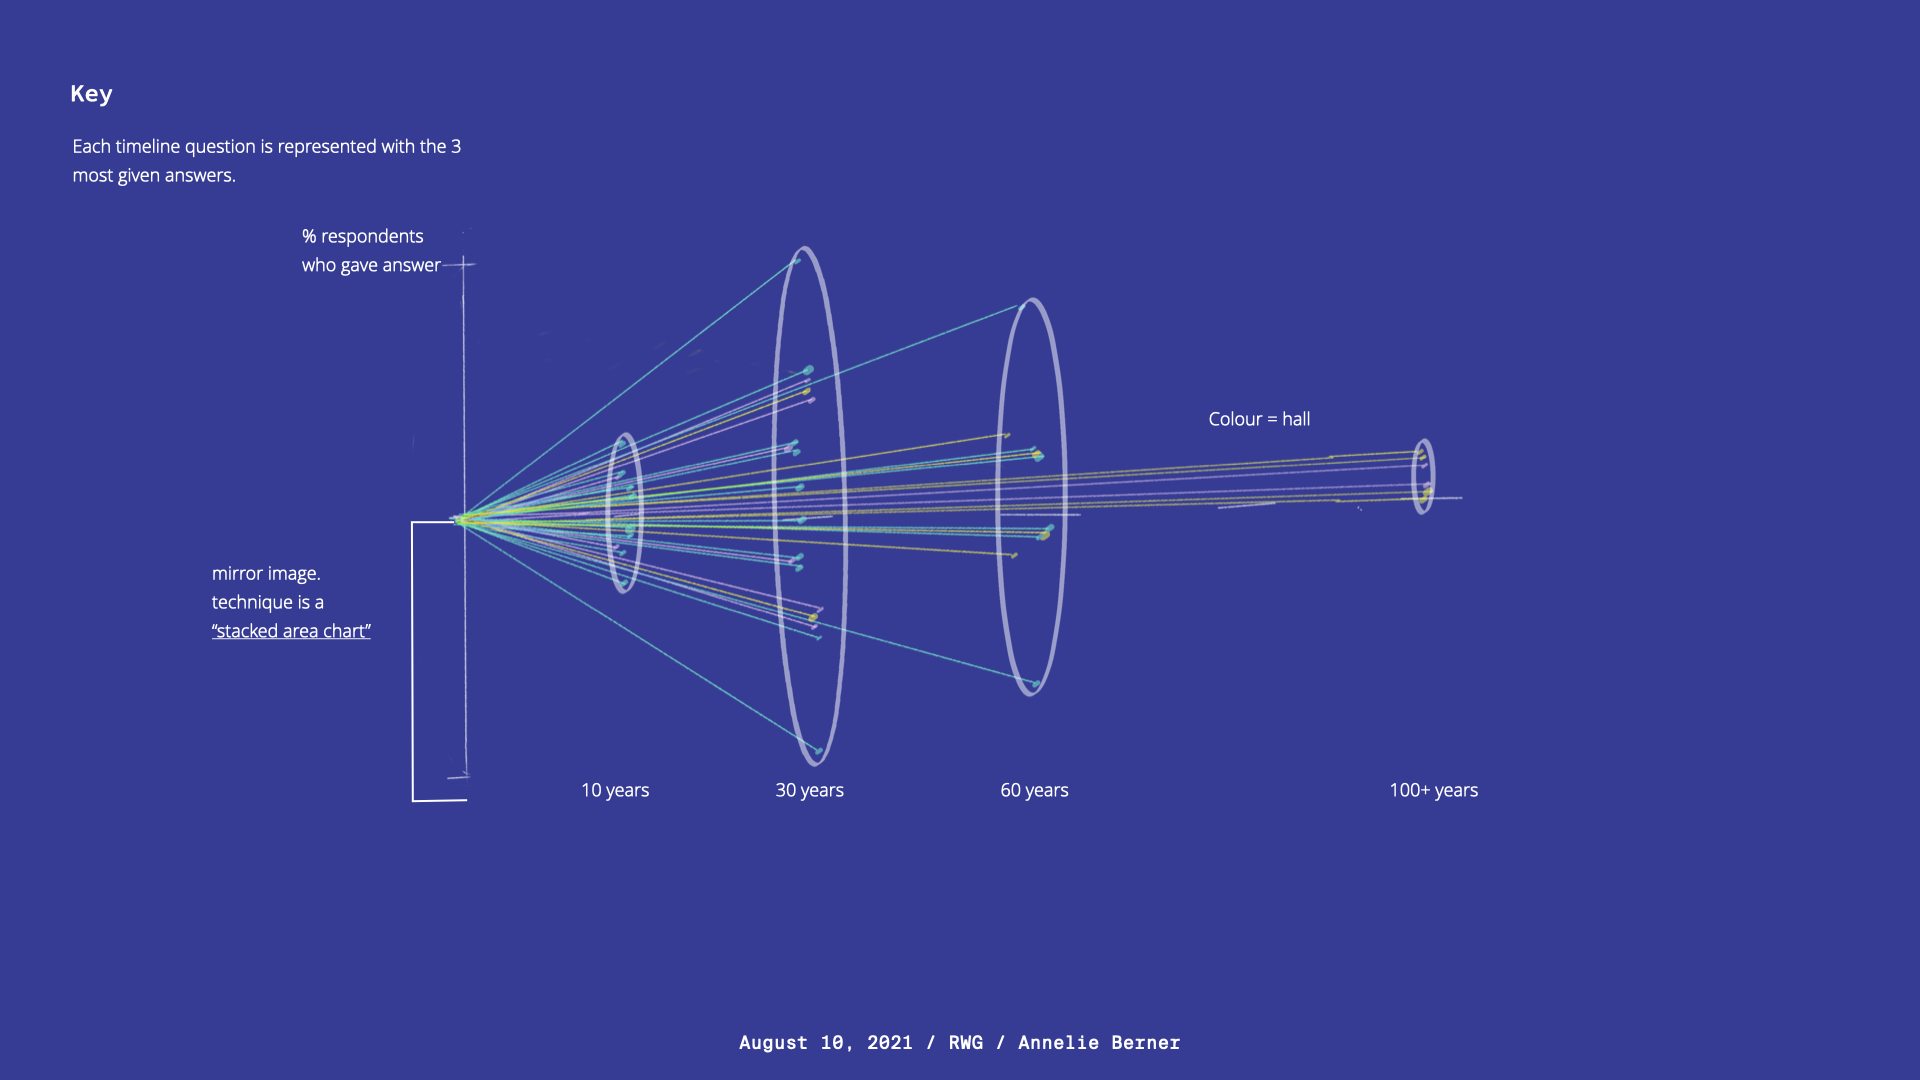
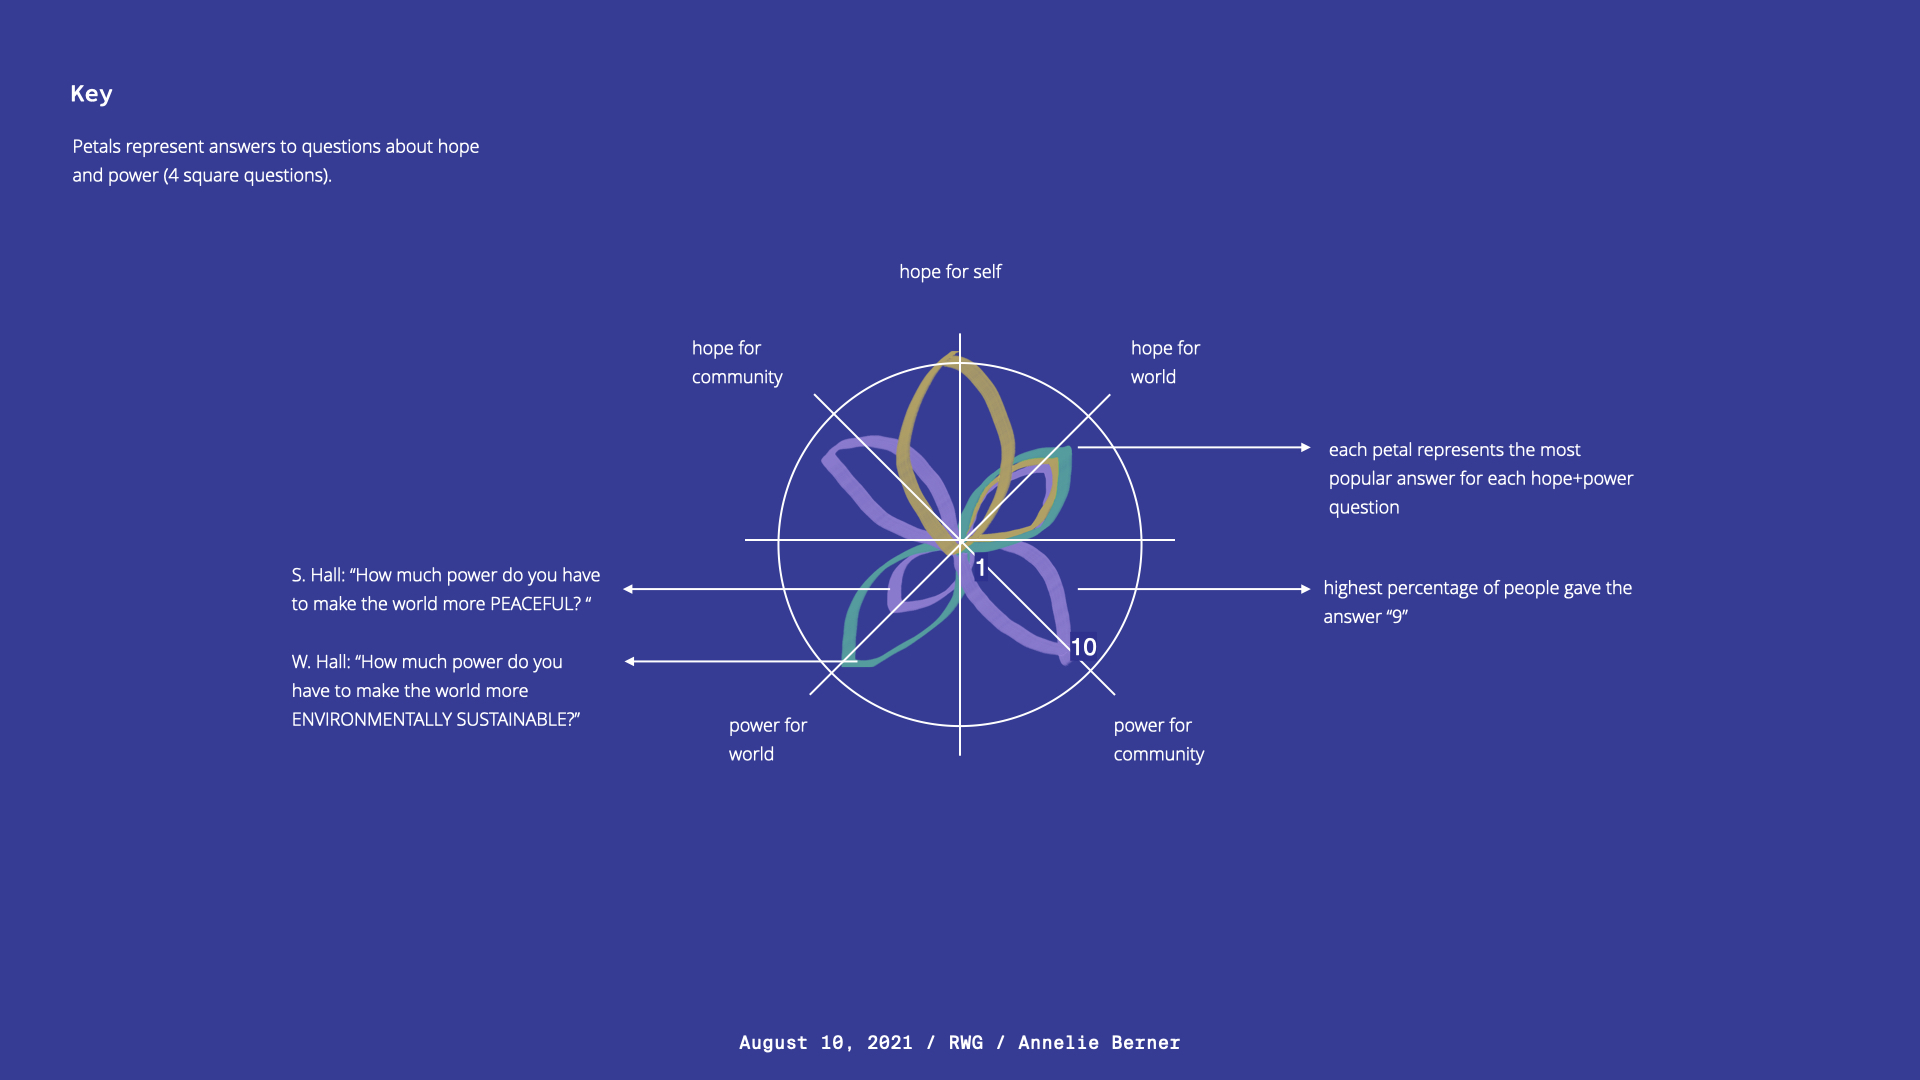
I handed over my prototype code of one of the data visualisations (Diverse Futures) and fullly fleshed out legends and sample datasets for the other visualisations. These were then implemented by the LAB once the exhibition was up and running, as shown below:


Exhibition link: Futures
Role: Designer, prototyper.
Technologies: d3.js